Call 211 For Non-Emergency Assistance
We support ALICE individuals in Lubbock. Learn more about ALICE and its prevalence and impact on our community.
ALICE stands for Asset Limited, Income Constrained, Employed. ALICE describes a group of individuals who earn above the federal poverty level but not enough to buy the essentials needed for everyday life.
In order to live, they choose between necessities to make ends meet, impacting the lives of their families and themselves.

See how ALICE affects households across Texas.
$59,161 (state avg.: $72,284)
30% (state avg.:29%)
127,879
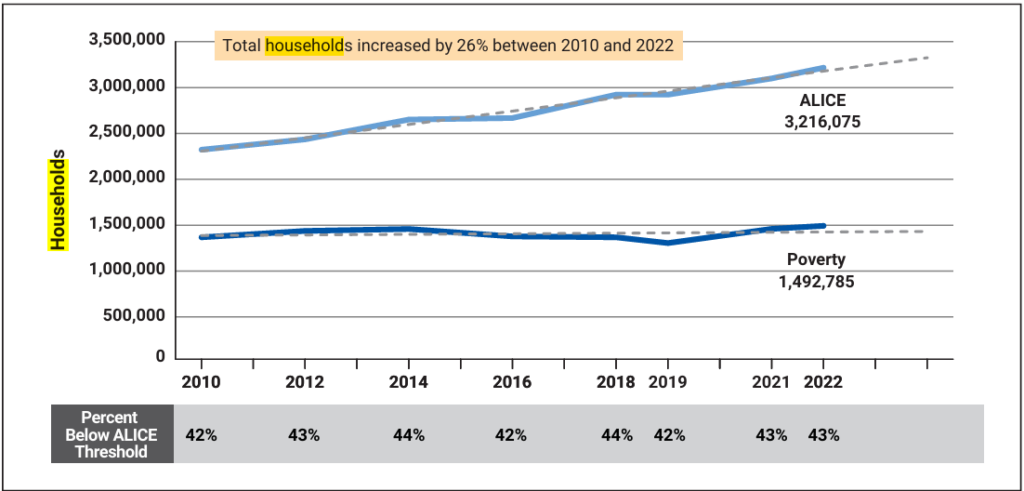
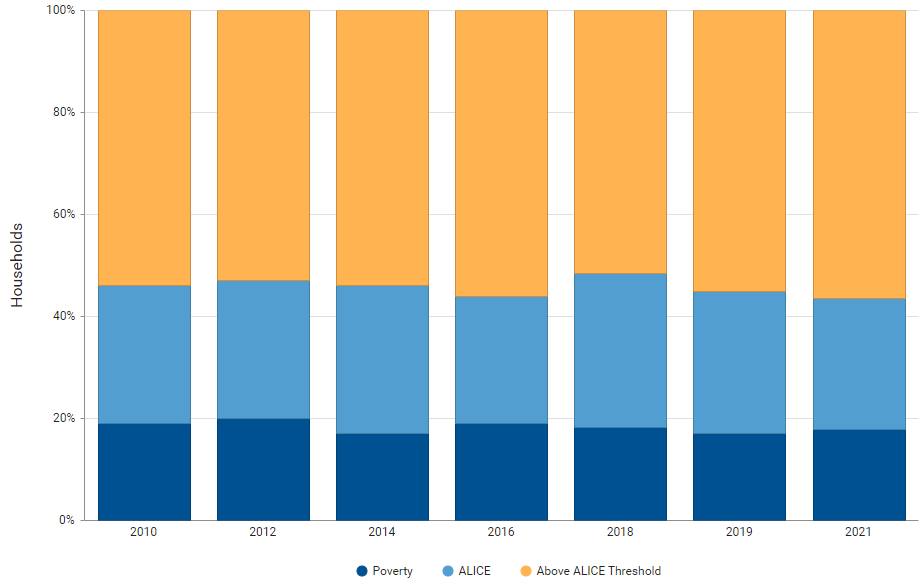
Despite some ups and downs in rates of financial hardship since the end of the Great Recession, the trend is clear: The number of ALICE households in Texas has been steadily growing. From 2010 to 2022, the total number of households in the state increased by 26%, the number of households in poverty increased by 9%, and the number of ALICE households increased by 38%. By 2022, 14 (1,492,785) of all households were below the FPL, and 29% (3,216,075) of all households were ALICE— a combined 43 (4,708,860) of households struggling to make ends meet.
Zooming in to the period around the COVID-19 pandemic (2019–2022), the rate of financial hardship in Texas remained largely unchanged (42% of households below the ALICE Threshold in 2019 and 43% in 2022). Yet by number, households below the ALICE Threshold continued to grow. This consistent trend — a growing number of households that are struggling financially, often ineligible for public assistance, and undercounted by official measures — represents a major vulnerability in our economic system. It also suggests that overall social and economic policies are falling short in addressing the root causes of financial instability.

The cost of basics is increasing faster than the overall rate of inflation, as reported by the ALICE Essentials Index. And it continues to be as difficult for ALICE to keep up with bills as at the height of the pandemic. According to the Household Pulse Survey, 55% of households below the ALICE Threshold in Texas reported that it was somewhat or very difficult to pay for usual items such as food, rent or mortgage, car payments, and medical expenses in October 2023,to 54% in August 2020.
Housing costs are on the rise in many parts of the state, and the impact is greater for those who were already struggling financially. According to the SHED, in 2022, 36% of households below the ALICE Threshold in Texas
reported that their rent or mortgage had increased in the prior 12 months (compared to 32% of households above the Threshold).
| Monthly Costs | |
|---|---|
| Housing – Rent | $521 |
| Housing – Utilities | $163 |
| Child Care | – |
| Food | $410 |
| Transportation | $409 |
| Health Care | $182 |
| Technology | $86 |
| Miscallaneous | $177 |
| Tax Before Credits | $241 |
| Monthly Total | $2,189 |
| ANNUAL TOTAL (Before Tax Credits) | $26,268 |
| Tax Credits (CTC & CDCTC) | $0 |
| ANNUAL TOTAL (With Tax Credits) | $26,268 |
| Full-Time Hourly Wage | $13.13 |
| Monthly Costs | |
|---|---|
| Housing – Rent | $521 |
| Housing – Utilities | $163 |
| Child Care | – |
| Food | $379 |
| Transportation | $345 |
| Health Care | $579 |
| Technology | $86 |
| Miscallaneous | $207 |
| Tax Before Credits | $306 |
| Monthly Total | $2,586 |
| ANNUAL TOTAL (Before Tax Credits) | $31,032 |
| Tax Credits (CTC & CDCTC) | $0 |
| ANNUAL TOTAL (With Tax Credits) | $31,032 |
| Full-Time Hourly Wage | $15.52 |
| Monthly Costs | |
|---|---|
| Housing – Rent | $616 |
| Housing – Utilities | $310 |
| Child Care | $1,136 |
| Food | $1,118 |
| Transportation | $1,059 |
| Health Care | $800 |
| Technology | $116 |
| Miscallaneous | $516 |
| Tax Before Credits | $830 |
| Monthly Total | $6,501 |
| ANNUAL TOTAL (Before Tax Credits) | $78,012 |
| Tax Credits (CTC & CDCTC) | ($5,196) |
| ANNUAL TOTAL (With Tax Credits) | $72,816 |
| Full-Time Hourly Wage | $36.41 |

The Household Survival Budget calculates the cost of household essentials for each county in Texas and relies on a wide range of public data sources, listed below. For household income, the ALICE measures rely on the U.S. Census Bureau’s American Community Survey (ACS) — both household tabulated data and individual data from the Public Use Microdata Sample (PUMS) records. Household costs are compared to household income to determine if households are below the ALICE Threshold.
As circumstances change, households may change below or above the ALICE threshold. While the COVID-19 pandemic brought employment shifts, health struggles, and school/business closures in 2021, it also spurred unprecedented public assistance through pandemic relief measures. In 2019, 53,106 households in Lubbock County were below the ALICE threshold; by 2021 that number increased to 54,121.


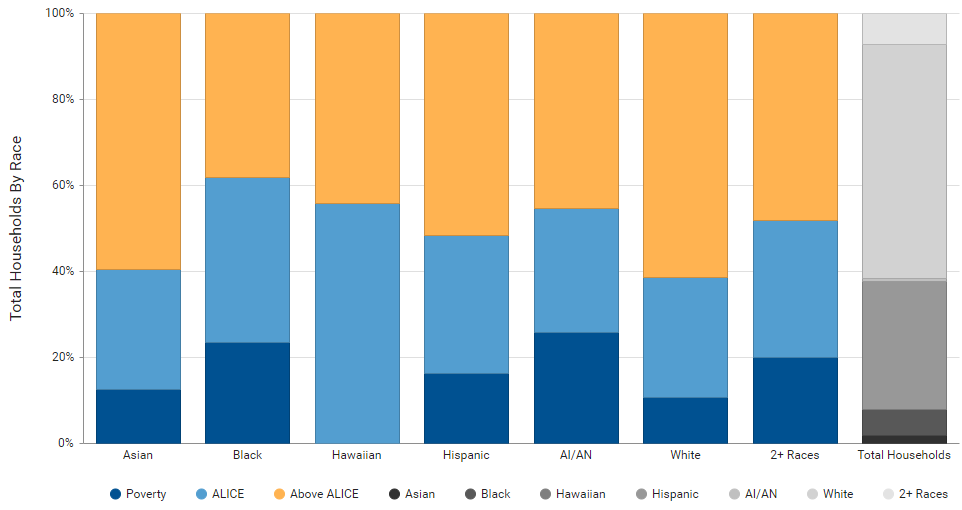
Groups with the largest population below the ALICE are also in the largest demographic groups. When observing the proportion of each group below the ALICE threshold, it’s clear that some ethnic and racial groups are more likely to be ALICE.
| Group | % Below Alice Threshold |
|---|---|
| Single or Cohabitating (no children) | 45% |
| Married (with children) | 14% |
| Single Female-Headed (with children) | 80% |
| Single Male-Headed (with children) | 39% |
| Group | % Below ALICE Threshold |
|---|---|
| Under 25 | 84% |
| 25 to 44 Years | 34% |
| 45 to 64 Years | 30% |
| Seniors (65+) | 52% |